We are all familiar with the concept of a function, a functional relationship. In mathematics, this concept has been given a name and clarified so that it can be studied. We all know that if the pressure in the faucet is greater, the tub will fill faster. This is an example of a relationship. Or if two bodies have the same density, their mass will depend on volume (the greater the volume, the greater the mass).
A function is a correspondence between sets that has a certain property. What is this property? If we take an element
from the first set
For example, every person has a shoe size, and only one shoe size. The dependence of shoe size on a person is functional. If we consider the inverse relationship, it is not functional, because many people can have the same shoe size.
Consider another example: the relationship between the perimeter of a square and its area. Knowing the perimeter we can uniquely find the side: ![]() . Then the area is:
. Then the area is: ![]() . This dependence will be functional (each square with a given perimeter corresponds to exactly one value of area).
. This dependence will be functional (each square with a given perimeter corresponds to exactly one value of area).
If we consider the relation between the perimeter of an arbitrary rectangle and its area, it will not be functional. For example, if we consider a rectangle with a perimeter of ![]() , its sides cannot be uniquely defined. They could be all
, its sides cannot be uniquely defined. They could be all ![]() (square), then the area would be
(square), then the area would be ![]() . Or they could be
. Or they could be ![]() ,
, ![]() ,
, ![]() ,
, ![]() , then the area would be
, then the area would be ![]() . Or they could be
. Or they could be ![]() ,
, ![]() ,
, ![]() ,
, ![]() , then the area would be
, then the area would be ![]() . The possible values of the sides are many, so the area cannot be determined unambiguously.
. The possible values of the sides are many, so the area cannot be determined unambiguously.
In addition to seeing that the relationship between the perimeter of an arbitrary rectangle and its area is not functional, we can see that for a given perimeter the square will have the largest area. This is an example of an extreme problem. For a given boundary length, a circle will have the largest area. That is, among all rectangles with the same perimeter, the square has the largest area, and if we consider all possible shapes with a given perimeter (not just rectangles), the circle has the largest area.
In order to define a function, we need to define two sets and the rule by which the correspondence between them is established. The first set is called the area of definition and is denoted by ![]() . For example:
. For example: ![]() (the set of all real numbers). The second set is called the area of values and is denoted by
(the set of all real numbers). The second set is called the area of values and is denoted by ![]() .
.
The rule by which a correspondence between elements of sets is determined can be specified in many ways, the most familiar to us is analytical (by means of a formula). For example, ![]() . You don't define the range of a function in this way, because it is set automatically: all possible values that
. You don't define the range of a function in this way, because it is set automatically: all possible values that ![]() can take for all
can take for all ![]() in the range of definition.
in the range of definition.
The graph of the function ![]() at
at ![]() looks like this (Fig. 1).
looks like this (Fig. 1).
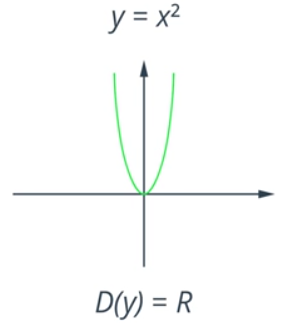
Fig. 1. The graph of the function ![]() at
at ![]()
If we were to change the area of definition, the function would also change. For example, ![]() at
at ![]() (Figure 2).
(Figure 2).
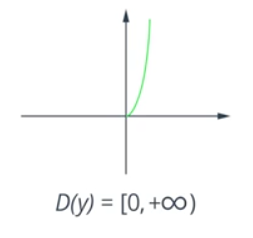
Fig. 2. The graph of the function ![]() at
at ![]()
And at ![]() (Fig. 3).
(Fig. 3).
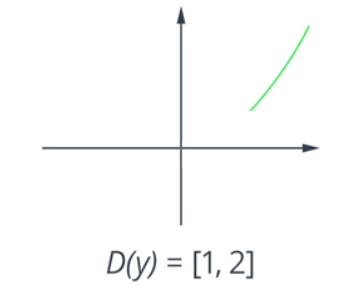
Fig. 3. The graph of the function ![]() at
at ![]()
Although the rule is set in the same way, we have three different functions before us.
School textbooks often contain the problem "Find the area of definition of a function...". Such tasks involve finding the natural area of definition, that is, the maximum subset of real numbers whose elements can be arguments to a function. For example, find the natural area of determination of ![]() . Since the denominator contains a variable, there may be a division by
. Since the denominator contains a variable, there may be a division by ![]() that is undefined. Therefore
that is undefined. Therefore ![]() is not included in the natural definition:
is not included in the natural definition: ![]() .
.
Function graphs
A graph is both a way of visualizing a function and a way of defining a function. That is, you can use a graph to see some properties of functions that are not obvious with other ways of setting a function. For example, having a table of values, it is difficult to analyze it, but if the same data is presented in graphical form, you can immediately see the properties (we can see the drop in the amount at a certain change) (Fig. 4).
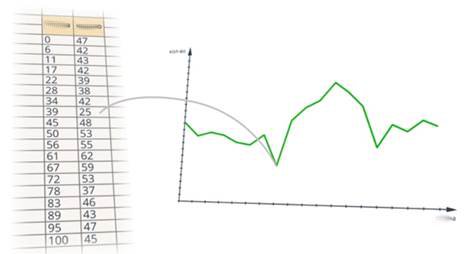
Figure 4. Illustration for the example
There are also situations where it is more convenient to use a tabular representation, for example, in statistics.
That is, there are basic ways of setting functions (verbal, analytical, graphical, tabular), each of which will be convenient depending on the situation.
2. If you find an error or inaccuracy, please describe it.
3. Positive feedback is welcome.