A function of type ![]() is called a quadratic function, and its graph is called a parabola. If
is called a quadratic function, and its graph is called a parabola. If ![]() , then the branches of the parabola "look up", if
, then the branches of the parabola "look up", if ![]() , then down.
, then down.
You know the simplest parabola very well: ![]() (see below). Note that the graph of this function is symmetric about the
(see below). Note that the graph of this function is symmetric about the ![]() -axis. Such functions are called even functions. Parity is expressed analytically by the condition
-axis. Such functions are called even functions. Parity is expressed analytically by the condition ![]() . Let us check for evenness of our function by substituting
. Let us check for evenness of our function by substituting ![]() instead of
instead of ![]() :
:
![]() , so the function
, so the function ![]() is even.
is even.
In the general case the quadratic function is not even, but nobody cancelled the symmetry of the parabola itself and it is convenient to use in practice.
How to quickly construct any parabola? Obviously, it is advantageous to find its vertex first, and then to find several pairs of symmetric points. Let's see how this happens using the example of the function ![]() :
:
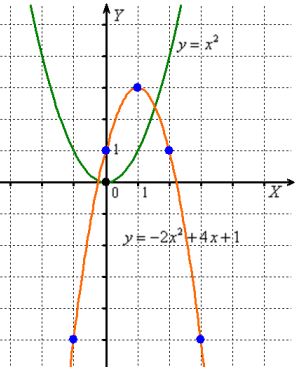 First, we find the vertex by taking the derivative and equating it to zero:
 ![]()
Let's find the root of the equation: ![]() - here is the vertex, its "Y":
- here is the vertex, its "Y": ![]()
Now find the reference points (usually four are enough), using the symmetry of the parabola and the "left-right" principle:
![]()
Attention! To check, calculate both values, they must coincide!
![]()
The steps listed are usually done verbally or on a draft, and the results are entered into a spreadsheet:
![]()
It remains to mark the found points on the drawing and CURRENTly connect them with a line. The considered algorithm is not necessary and in simple cases a vertex of a parabola can be found simply by going through the points.
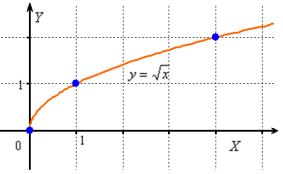 The graph of the function
 ![]() is a branch of a parabola that "lies on its side":
is a branch of a parabola that "lies on its side":
As already noted, this function is defined only for non-negative "X": ![]() ,
,
and it is convenient to use the following anchor points to construct the graph:
![]()
The graph of function ![]() is called a cubic parabola. This function is symmetric about the beginning of coordinates, and such functions are called odd functions.
is called a cubic parabola. This function is symmetric about the beginning of coordinates, and such functions are called odd functions.
Analytically, the oddness is expressed by the condition ![]() . Let's check our function for oddness by substituting
. Let's check our function for oddness by substituting ![]() instead of
instead of ![]() :
: ![]() ,
,
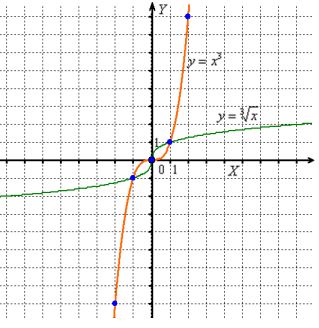
To build a cubic parabola it is enough to mark points:
![]()
then take advantage of symmetry or just the oddness of the function:
![]() .
.
The graph of function ![]() is a cubic parabola "lying on its side". In contrast to
is a cubic parabola "lying on its side". In contrast to ![]() , this function is defined for all "X":
, this function is defined for all "X": ![]() and is also odd, because the "minus" is safely carried forward:
and is also odd, because the "minus" is safely carried forward:
![]()
The graph of an arbitrary root ![]() with a fractional exponent should be plotted, bearing in mind the area of determination of one or another root.
with a fractional exponent should be plotted, bearing in mind the area of determination of one or another root.
So, the function ![]() , like
, like ![]() , is defined only for non-negative "X":
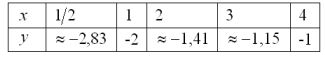
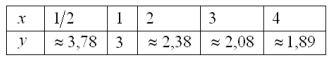
, is defined only for non-negative "X": ![]() and to construct its graph you will have to find several values approximately:
and to construct its graph you will have to find several values approximately:
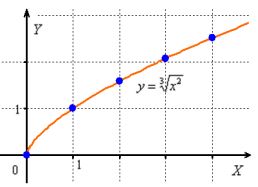
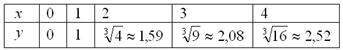
Such values are called "bad" in mathematical jargon, but what can you do....
This function is not even or odd, because it is not defined for negative "X", which means that the condition ![]() or
or ![]() simply cannot be met.
simply cannot be met.
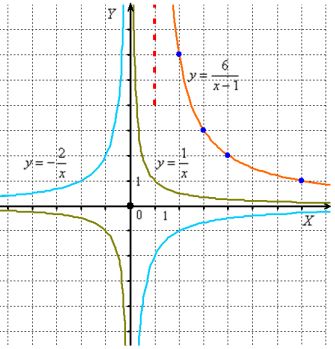
The graph of the function ![]() is a hyperbola. Yes, it is also a power function! For
is a hyperbola. Yes, it is also a power function! For ![]() . If
. If ![]() , then the branches of the hyperbola lie in the 1st and 3rd coordinate quarters, if
, then the branches of the hyperbola lie in the 1st and 3rd coordinate quarters, if ![]() , then in the 2nd and 4th coordinate quarters (see examples in the drawing below).
, then in the 2nd and 4th coordinate quarters (see examples in the drawing below).
Obviously, we are facing an odd function, because: ![]() .
.
This function is not defined at point ![]() , and the coordinate axes are asymptotes of the graph - you cannot "climb on them"! An asymptote is a line to which the graph approaches infinitely close, but does not cross it.
, and the coordinate axes are asymptotes of the graph - you cannot "climb on them"! An asymptote is a line to which the graph approaches infinitely close, but does not cross it.
How do I quickly graph a hyperbola? (and not just any hyperbola)
In many cases it is convenient to draw a point-by-point, let's build, for example, the right branch of ![]() .
.
This function is not defined at point ![]() , so the vertical asymptote will be exactly here.
, so the vertical asymptote will be exactly here.
Let's find several reference points (selecting convenient values of "X"):
![]()
Mark these points on the drawing and carefully connect them with a line.
Essentially the same form has graphs ![]() - only in the first case the hyperbola will have one branch, in the second - two branches located in the 1st and 2nd coordinate quarters, and the third hyperbola will be similar to
- only in the first case the hyperbola will have one branch, in the second - two branches located in the 1st and 2nd coordinate quarters, and the third hyperbola will be similar to ![]() .
.
Exercises
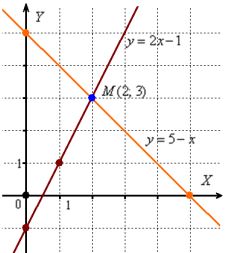 Here you need to draw two lines and determine their point of intersection. Its coordinates will be the solution of the system.
 From the first equation we express:
x + y = 5 => y = 5- x, let's select the following reference points:
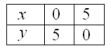
To plot -2x + y = -1 => y = 2x - 1 it is convenient to choose the points:
It follows from the drawing that the lines intersect at the point M(2; 3)
Answer:
x = 2, y = 3
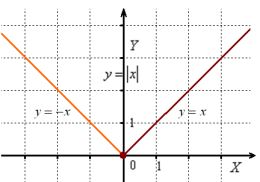 Expanding the module:
 Such functions are called piecewise functions.
Plotting the graphs of the functions y = -x, y = x on the corresponding intervals.
The function "module x" is even, since:
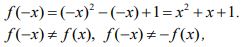
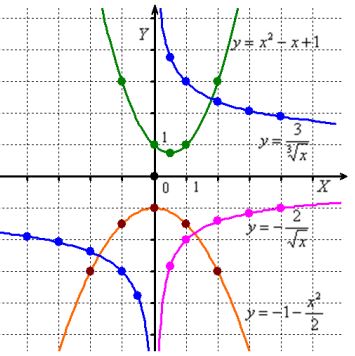 1.) Check for an even/odd function
 it means that this function is not even or odd.
When finding the anchor points, we we get symmetric ones at once, from which it is clear where the vertex is:
2.) Let's check the function
means that it is even and there are no problems with the vertex and reference points there is no problem.
3.) The function
4.) Let's investigate the function
We find the points of the left branch from symmetry considerations or by using the analytical condition of oddness, for example: ƒ(-1) = -3 .
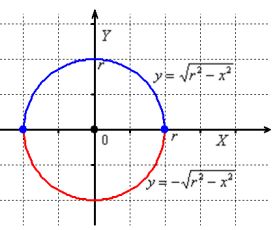 Write the equation as
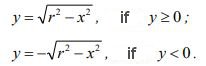
The first function defines the upper half-circle (since "Y" are non-negative), and the second function the lower half-circle.
The domain of each function is
2. If you find an error or inaccuracy, please describe it.
3. Positive feedback is welcome.