In this lesson we will begin studying the graph of a function called a hyperbola. The function itself is called inverse proportionality. Not only mathematical problems are associated with this function, but also a number of problems, for example economics and physics. We will study the properties of this function, plot the graphs, and study the increasing and decreasing of the function.
![]() , where:
, where:
![]() – independent variable (argument);
– independent variable (argument);
![]() – dependent variable (function);
– dependent variable (function);
![]() – coefficient (number).
– coefficient (number).
The graph of the function ![]() is the set of points
is the set of points ![]() where
where ![]() .
.
The coefficient ![]() can take any values except
can take any values except ![]() . Let us first consider the case when
. Let us first consider the case when ![]() ; thus, we will first deal with the function
; thus, we will first deal with the function ![]() .
.
To plot the function ![]() , give the independent variable
, give the independent variable ![]() some specific values and calculate (using a formula
some specific values and calculate (using a formula![]() ) the corresponding values of the dependent variable
) the corresponding values of the dependent variable ![]() . We record the results in a table: one table for
. We record the results in a table: one table for ![]() , another for
, another for ![]() .
.
|
|
|
|
|
|
|
|
|
|
|
|
|
|
|
|
|||||
|
|
|
|
|
|
|
|
|
|
|
|
|
|
|
|
|||||
Plot the found points ![]() ,
, ![]() ,
, ![]() ,
, ![]() ,
, ![]() on the coordinate plane
on the coordinate plane ![]() and connect them, thus obtaining the right branch of the graph (see Fig. 1).
and connect them, thus obtaining the right branch of the graph (see Fig. 1).
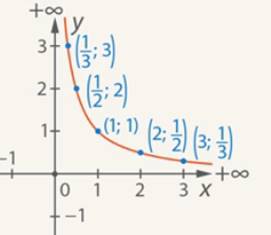
Fig. 1. The right branch of the graph ![]()
Plot the found points ![]() ,
, ![]() ,
, ![]() ,
, ![]() on the coordinate plane
on the coordinate plane ![]() and connect them, thus obtaining the right branch of the graph (see Fig. 2).
and connect them, thus obtaining the right branch of the graph (see Fig. 2).
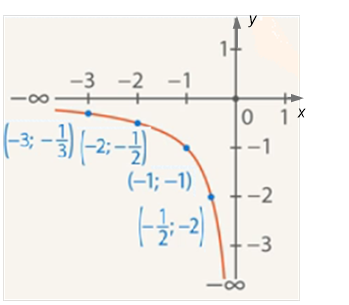
Fig. 2. The left branch of the graph
Combine these two branches (see Fig. 3). This is the graph of the function ![]() ; it is called a hyperbola.
; it is called a hyperbola.
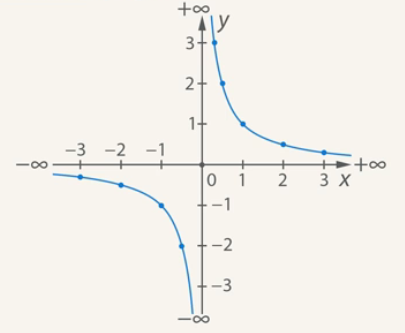
Fig. 3. The graph of the function ![]() (hyperbola)
(hyperbola)
You can see that the graph consists of two parts. These parts are called branches of the hyperbola.
1. For ![]() (right branch):
(right branch):
- with ![]() tending to plus infinity,
tending to plus infinity, ![]() tends to zero:
tends to zero:
![]() ,
, ![]() , hence, the
, hence, the ![]() -axis is the horizontal asymptote.
-axis is the horizontal asymptote.
Asymptote (from Greek asimptotos - "non-conforming") is a line to which an infinite branch of a curve approaches indefinitely.
- with ![]() tending to zero,
tending to zero, ![]() tends to plus infinity:
tends to plus infinity:
![]() ,
, ![]() , hence the
, hence the ![]() -axis is a vertical asymptote.
-axis is a vertical asymptote.
For ![]() (left branch):
(left branch):
- with ![]() tending to minus infinity,
tending to minus infinity, ![]() tends to zero:
tends to zero:
![]() ,
, ![]() ,, hence the
,, hence the ![]() -axis is a horizontal asymptote.
-axis is a horizontal asymptote.
- with ![]() tending to zero,
tending to zero, ![]() tends to minus infinity:
tends to minus infinity:
![]() ,
, ![]() , hence the
, hence the ![]() -axis is a vertical asymptote.
-axis is a vertical asymptote.
2. For ![]() (right branch)
(right branch)
Take any two points ![]() and
and ![]() , we obtain the segment
, we obtain the segment ![]() and the arc
and the arc ![]() . The arc is under the segment, hence the function under study is convex downward at
. The arc is under the segment, hence the function under study is convex downward at ![]() .
.
For ![]() (left branch)
(left branch)
Take any two points ![]() and
and ![]() , we obtain a segment
, we obtain a segment ![]() and an arc
and an arc ![]() . The arc is above the segment, hence the function under study is convex upwards at
. The arc is above the segment, hence the function under study is convex upwards at ![]() (see Fig. 4).
(see Fig. 4).
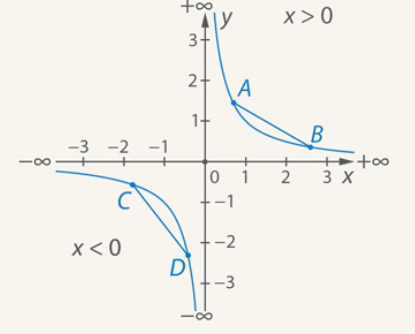
Fig. 4. Study of function ![]()
![]() Reminder
Reminder
Axial symmetry (symmetry relative to a straight line)
Points ![]() and
and ![]() are symmetric with respect to line
are symmetric with respect to line ![]() if it serves as the median perpendicular to segment
if it serves as the median perpendicular to segment ![]() (see Figure 5).
(see Figure 5).
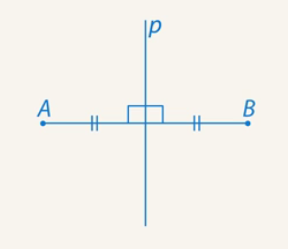
Fig. 5. Axial symmetry
Central symmetry (symmetry relative to the point)
Points ![]() and
and ![]() are symmetric with respect to point
are symmetric with respect to point ![]() if segment
if segment ![]() is equal to segment
is equal to segment ![]() (see Fig. 6).
(see Fig. 6).
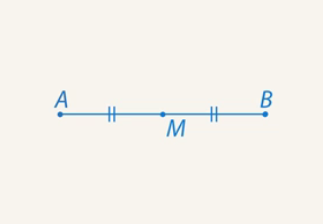
Fig. 6. Central symmetry
3. Draw the line ![]() . If we bend the graph of the function under study through this line, the branches will coincide. For example, the point
. If we bend the graph of the function under study through this line, the branches will coincide. For example, the point ![]() will coincide with the point
will coincide with the point ![]() . Consequently, the line
. Consequently, the line ![]() is the median perpendicular to the segment
is the median perpendicular to the segment ![]() . Thus line
. Thus line ![]() is the symmetry axis of the graph
is the symmetry axis of the graph ![]() (see Fig. 7).
(see Fig. 7).
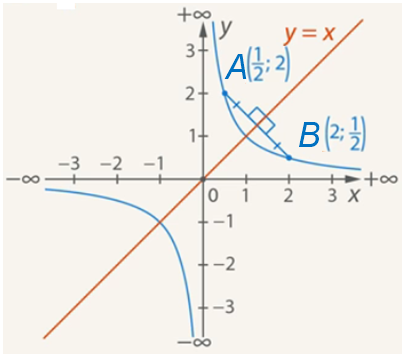
Fig. 7. The symmetry axis of the hyperbola
4. The point with coordinates ![]() is the center of symmetry of the graph
is the center of symmetry of the graph ![]() .
.
We have considered the properties of the function ![]() , and the same properties will hold for the function
, and the same properties will hold for the function ![]() for any
for any ![]() (see Figure 8).
(see Figure 8).
1. The area of the function is the set of all real numbers except ![]() .
.
2. The numbers ![]() and
and ![]() are of the same sign, therefore:
are of the same sign, therefore:
![]() at
at ![]()
![]() at
at ![]()
3. The function is bounded neither from below nor from above. This follows from the fact that ![]()
4. At ![]() the function decreases and is convex upwards; at
the function decreases and is convex upwards; at ![]() the function decreases and is convex downwards.
the function decreases and is convex downwards.
5. Point ![]() is the center of symmetry of the hyperbola.
is the center of symmetry of the hyperbola.
6. The straight ![]() axis of symmetry of the hyperbola.
axis of symmetry of the hyperbola.
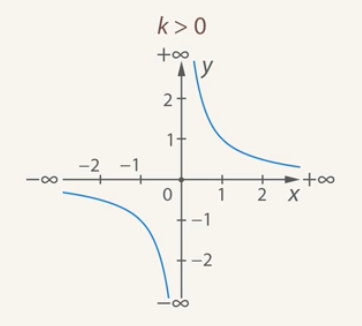
Fig. 8. The graph of the function ![]() at
at ![]()
Proof of axial symmetry of the hyperbola
The graph of the function ![]() .
.
1. Let ![]() be any value of the argument from the definition area. Then on the branch of the hyperbola we have point
be any value of the argument from the definition area. Then on the branch of the hyperbola we have point ![]() .
.
2. Let ![]() be any value of the argument from the definition area. Then we have point
be any value of the argument from the definition area. Then we have point ![]() on the branch of the hyperbola.
on the branch of the hyperbola.
It is necessary to prove that an arbitrarily chosen point ![]() is symmetric to point
is symmetric to point ![]() with respect to line
with respect to line ![]() (see Fig. 9).
(see Fig. 9).
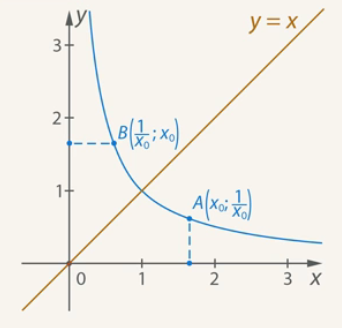
Figure 9. Illustration of the proof
Proof
1. Mark the point ![]() on the abscissa axis and the point
on the abscissa axis and the point ![]() on the ordinate axis (see Fig. 10).
on the ordinate axis (see Fig. 10).
2. Consider right triangles ![]() and
and ![]() . These triangles are equal by two cathetuses (
. These triangles are equal by two cathetuses (![]() ;
; ![]() ). It follows from the equality of these triangles:
). It follows from the equality of these triangles:
а) ![]() ;
;
b) ![]() ;
;
с) ![]() (since line
(since line ![]() is the bisector of the coordinate angle, and
is the bisector of the coordinate angle, and ![]() )
)
3. Consider triangle ![]() : it is isosceles, the line
: it is isosceles, the line ![]() lies on the bisector of the triangle. It is known that in an isosceles triangle the bisector originating from the angle formed by equal sides is also the altitude and the median. Hence, line
lies on the bisector of the triangle. It is known that in an isosceles triangle the bisector originating from the angle formed by equal sides is also the altitude and the median. Hence, line ![]() is the median perpendicular to the segment
is the median perpendicular to the segment ![]() ; arbitrarily chosen point
; arbitrarily chosen point ![]() is symmetric to the point
is symmetric to the point ![]() with respect to the line
with respect to the line ![]() .
.
Since the points were chosen arbitrarily, the entire curve ![]() is symmetric about the
is symmetric about the ![]() .
.
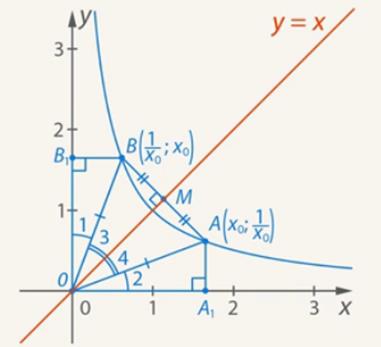
Figure 10. illustration of the proof
At ![]() , the branches of the hyperbola are located in the second and fourth coordinate angles (see Fig. 11).
, the branches of the hyperbola are located in the second and fourth coordinate angles (see Fig. 11).
1. The domain of the function is the set of all real numbers except ![]() .
.
2. The numbers ![]() and
and ![]() are different signs, therefore:
are different signs, therefore:
![]() at
at ![]()
![]() at
at ![]()
3. The function is not limited either from below or from above.
4. At ![]() , the function increases and is convex downward; at
, the function increases and is convex downward; at ![]() , the function increases and is convex upward.
, the function increases and is convex upward.
5. Point ![]() is the center of symmetry of the hyperbola.
is the center of symmetry of the hyperbola.
6. The straight ![]() axis of symmetry of the hyperbola.
axis of symmetry of the hyperbola.
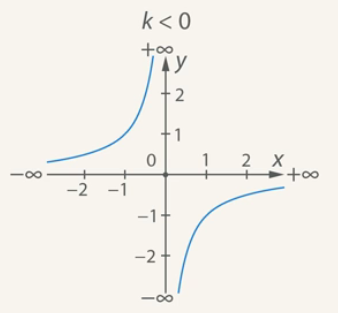
Fig. 11. The graph of the function ![]() at
at ![]()
2. If you find an error or inaccuracy, please describe it.
3. Positive feedback is welcome.