Properties of function y=x2
We plotted the graph ![]() by points. It looked like this (see Fig. 1):
by points. It looked like this (see Fig. 1):
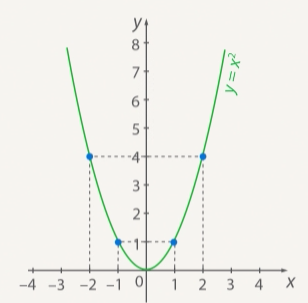
Fig. 1. Graph of the function ![]()
Note that the value of the function at any point is non-negative - this is logical, because squaring cannot result in a negative number, which means that everything under the ![]() axis cannot belong to our graph.
axis cannot belong to our graph.
Note also that this graph is symmetric with respect to the ordinate axis. There is a special name for such functions: they are called even functions. Even functions have a graph symmetric with respect to ![]() , and this is due to the fact that
, and this is due to the fact that ![]() , like for our function.
, like for our function.
Note also that our graph decreases before 0, and increases after 0 (see Fig. 2).

Fig. 2. Decreasing and increasing of the graph of the function ![]()
Accordingly, the greater ![]() (at
(at ![]() ), the greater
), the greater ![]() and the greater
and the greater ![]() (at
(at ![]() ), the greater
), the greater ![]() .
.
Properties of the function y=k*x2 when k > 0
Now let's try to change ![]() , for now we'll take it only positive.
, for now we'll take it only positive.
For example, take k=2 and k=0.5. If we plot by points, we can see that at x=0; y=0 (see Fig. 3).
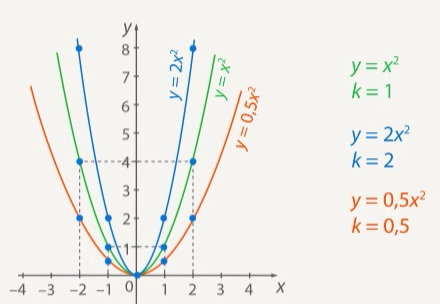
Figure 3. Graphs of the functions ![]() (blue graph) and
(blue graph) and ![]() (red)
(red)
Although we only gave three examples, we can already draw some conclusions about the function ![]() , at
, at ![]() . First, the graph of such a function lies in the upper half-plane. And this is logical: if the square of a number (a non-negative number) is multiplied by a positive number
. First, the graph of such a function lies in the upper half-plane. And this is logical: if the square of a number (a non-negative number) is multiplied by a positive number ![]() , the result is non-negative.
, the result is non-negative.
Property 1. The set of values of function ![]() at
at ![]() is all non-negative numbers (
is all non-negative numbers (![]() ).
).
Further, we note that if we substitute ![]() into this function, we still get
into this function, we still get ![]() . Therefore we can formulate another property.
. Therefore we can formulate another property.
Property 2. The graph ![]() at
at ![]() is symmetric about the
is symmetric about the ![]() -axis (see Fig. 4).
-axis (see Fig. 4).

Fig. 4. The parity of functions
Such functions are called even functions.
Learn more about function properties
So, we are talking about a function ![]() . Let us distinguish several properties of it.
. Let us distinguish several properties of it.
1. Parity. A function is said to be even if for any ![]() of its domain
of its domain ![]() . For example,
. For example, ![]() is an even function.
is an even function.
The graph of an even function is always symmetric about the ordinate axis (see Fig. 5).
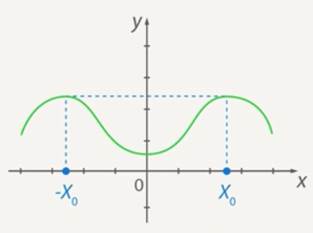
Fig. 5. Symmetry of the graph of an even function with respect to the ordinate axis
Similarly, a function is called odd if for any of its domain ![]() . In particular,
. In particular, ![]() is an odd function. The graph of an odd function is symmetric with respect to the origin.
is an odd function. The graph of an odd function is symmetric with respect to the origin.
2. Monotonicity. A function is said to increase (strictly) on some interval if for any ![]()
![]() . But if for all such
. But if for all such ![]() :
: ![]() , the function decreases on this interval.
, the function decreases on this interval.
For example. ![]() . Then if
. Then if ![]() , then
, then ![]() (since
(since ![]() ). So the function is increasing for positive
). So the function is increasing for positive ![]() . Similarly, we prove that it decreases for negative
. Similarly, we prove that it decreases for negative ![]() .
.
The graphs and the equation of the function show that its smallest value is reached at zero and is equal to zero (indeed, the square of any other number is strictly positive). There is no largest value: the more we take modulo ![]() , the more
, the more ![]() we get.
we get.
Property 3. The graph ![]() at
at ![]() increases for positive X and decreases for negative X (see Fig. 6).
increases for positive X and decreases for negative X (see Fig. 6).
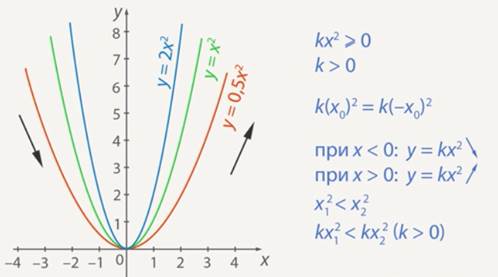
Fig. 6. Decreasing and increasing of the function ![]()
Transformation of the graph of the function y=k*x2 by changing k
What happens to the graph if we increase the number ![]() ? If we plot by points, then if we increase
? If we plot by points, then if we increase ![]() by a factor of two, for example, the ordinate of a point with the same abscissa will increase by the same factor of two. That is, in theory, the graph should become narrower. And vice versa, if
by a factor of two, for example, the ordinate of a point with the same abscissa will increase by the same factor of two. That is, in theory, the graph should become narrower. And vice versa, if ![]() decreases (leaving it positive), it will become wider (see Fig. 3). This hypothesis can be checked visually (see Fig. 7 and Fig. 8).
decreases (leaving it positive), it will become wider (see Fig. 3). This hypothesis can be checked visually (see Fig. 7 and Fig. 8).
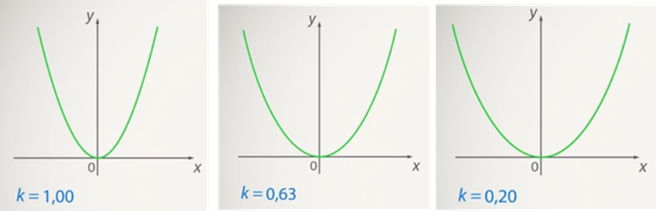
Figure 7. As ![]() decreases, the graph expands
decreases, the graph expands
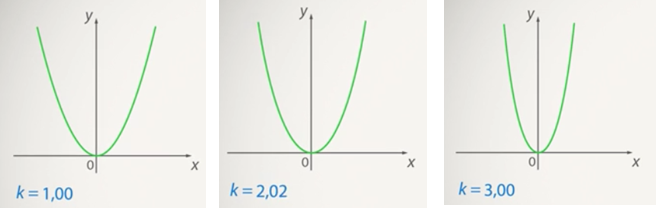
Fig. 8. As ![]() increases, the graph narrows
increases, the graph narrows
Thus, keeping this property in mind, you can always plot the graph of function ![]() depending on
depending on ![]() by narrowing or expanding the graph of function
by narrowing or expanding the graph of function ![]() .
.
Problem (k > 0)
What is the largest and smallest value of the function ![]() on the segment
on the segment ![]() (See Figure 9.)
(See Figure 9.)
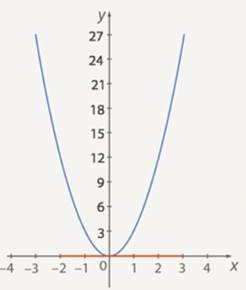
Fig. 9. The graph of the function ![]()
Solution
Everything is clear with the smallest value: the graph (and the property) show that the smallest value is ![]() . But what about the largest value? We can see that the further the abscissa is from zero, the greater the value of the function. This makes sense: the greater the value of the function, the greater the modulus of the abscissa. So the greatest value is reached at point
. But what about the largest value? We can see that the further the abscissa is from zero, the greater the value of the function. This makes sense: the greater the value of the function, the greater the modulus of the abscissa. So the greatest value is reached at point ![]() and it is
and it is ![]() .
.
Answer: ![]() .
.
Properties of the function y=k*x2 when k < 0
Now let's turn to negative ![]() . We can draw the function
. We can draw the function ![]() at
at ![]() by points. Or you can take, for example, the graph of
by points. Or you can take, for example, the graph of ![]() , which we already know how to draw, and then multiply each value by
, which we already know how to draw, and then multiply each value by ![]() . How do you draw a graph? Multiplying by
. How do you draw a graph? Multiplying by ![]() changes the sign of the ordinate, so essentially we just mirror the graph with respect to the abscissa axis (see Figure 10).
changes the sign of the ordinate, so essentially we just mirror the graph with respect to the abscissa axis (see Figure 10).
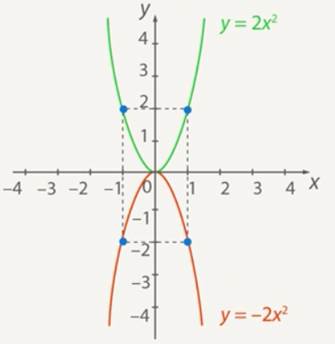
Fig. 10. Construction of the function ![]() at
at ![]()
1. Property 1. The set of values of the function ![]() at
at ![]() is all nonpositive numbers (
is all nonpositive numbers (![]() ) (see Fig. 11).
) (see Fig. 11).
The graph of the function is in the lower half-plane.
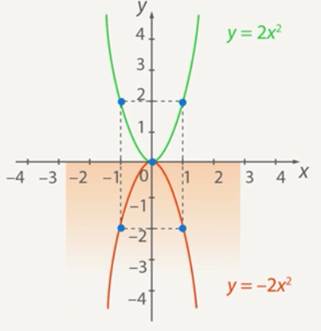
Figure 11. The function ![]() takes non-positive values at
takes non-positive values at ![]()
2. Property 2. The graph ![]() at
at ![]() is symmetric about the axis
is symmetric about the axis ![]() - the function is even (
- the function is even (![]() ).
).
3. Property 3. The graph ![]() at
at ![]() increases for negative
increases for negative ![]() and decreases for positive (see Figure 12).
and decreases for positive (see Figure 12).
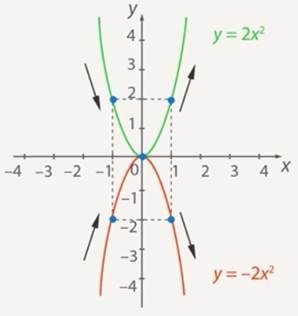
Fig. 12. Decreasing and increasing of the function ![]() at
at ![]()
4. Transformations of the graph of function ![]() at
at ![]() : the graph narrows as
: the graph narrows as ![]() decreases and widens as
decreases and widens as ![]() increases (see Fig. 13).
increases (see Fig. 13).
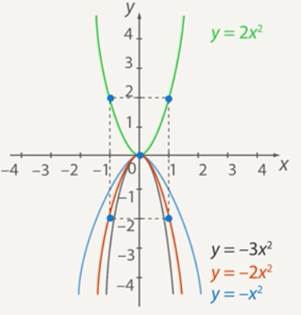
Fig. 13. Transformations of the graph of the function ![]() at
at ![]()
Problem (k < 0)
At what value of ![]() does the graph of the function
does the graph of the function ![]() pass through point
pass through point ![]() ? Draw this graph.
? Draw this graph.
Solution
Substitute the coordinates of the point into the equation. We obtain:![]() .
.
Now plot ![]() (see Fig. 14).
(see Fig. 14).
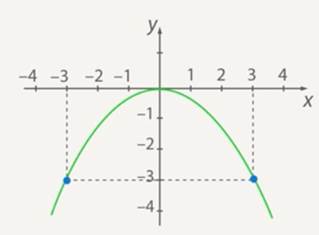
Figure 14. graph of the ![]() function
function
You can check yourself from the graph - the graph passes through point ![]() .
.
Note that the negativity of the number ![]() was obvious at once: since our function takes a negative value at least at one point, it must be negative.
was obvious at once: since our function takes a negative value at least at one point, it must be negative.
Answer: ![]() .
.
Solve the equation: ![]() .
.
Solution
Solve this equation graphically by plotting the left and right parts of the equation (see Figure 15):
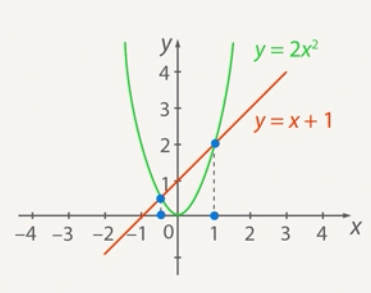
Figure 15. solving the equation graphically
You can see from the graph that this equation has two solutions: ![]() and
and ![]() . Note that if the root of
. Note that if the root of ![]() is easy to see from the graph, then
is easy to see from the graph, then ![]() is more complicated - it is a noninteger. Therefore usually in such cases the hypothesis is made that
is more complicated - it is a noninteger. Therefore usually in such cases the hypothesis is made that ![]() is the root, and then the test is performed by substitution.
is the root, and then the test is performed by substitution.
Answer: ![]() .
.
Conclusion
In this lesson we found out what the graph of the function ![]() looks like and how it changes as
looks like and how it changes as ![]() changes. We found out what properties this graph has:
changes. We found out what properties this graph has:
1. value area: ![]() at
at ![]() ,
, ![]() at
at ![]() .
.
2. Parity (the graph is symmetric about the ![]() axis).
axis).
3. Monotonicity: at ![]() it increases at negative
it increases at negative ![]() and decreases at positive; at
and decreases at positive; at ![]() it increases at positive
it increases at positive ![]() and decreases at negative.
and decreases at negative.
2. If you find an error or inaccuracy, please describe it.
3. Positive feedback is welcome.