Earlier we solved equations and inequalities analytically, and now we will breathe geometric meaning into these problems. And it will inspire you! - it will be easy, it will be cool, and it will be beautiful! And most importantly, it will be extremely useful.
First a special case. To solve an equation of the form ![]() , you must plot the graph of the function
, you must plot the graph of the function ![]() and see where it intersects the abscissa axis. This is where the roots are found. If there are no intersection points, then the equation has no valid solutions.
and see where it intersects the abscissa axis. This is where the roots are found. If there are no intersection points, then the equation has no valid solutions.
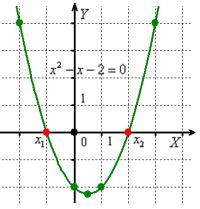
 So, when solving the quadratic equation
 ![]() through the discriminant we got the roots of
through the discriminant we got the roots of ![]() , but here you can just plot the parabola and everything is clear without comment.
, but here you can just plot the parabola and everything is clear without comment.
The solutions of inequality ![]() are those intervals where the graph
are those intervals where the graph ![]() is above the OX axis, and, conversely,
is above the OX axis, and, conversely, ![]() is where the graph
is where the graph ![]() is below the axis.
is below the axis.
Thus, instead of trying to solve the inequality ![]() using the method of intervals, we just look at the graph and the answer is ready:
using the method of intervals, we just look at the graph and the answer is ready: ![]() . Accordingly, the solution of the inequality
. Accordingly, the solution of the inequality ![]() is the interval
is the interval ![]() .
.
In the case of non-strict ![]() inequalities, the boundary points must be added to the solutions:
inequalities, the boundary points must be added to the solutions: ![]() and
and ![]() , respectively.
, respectively.
And if you don't want to bother with finding reference points, "poking at them at random" (because parabolas can be large, sprawling), then there is a general case:
To solve equation ![]() , you need to plot the graphs of
, you need to plot the graphs of ![]() and find their intersection points. The "X" coordinates of these points will be the solutions. If the graphs do not intersect, then there are no valid solutions.
and find their intersection points. The "X" coordinates of these points will be the solutions. If the graphs do not intersect, then there are no valid solutions.
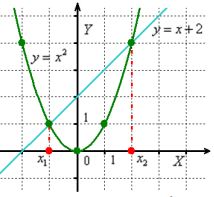
Thus, instead of solving the equation ![]() by drawing a parabola, let us represent it as
by drawing a parabola, let us represent it as ![]() and depict the elementary graphs:
and depict the elementary graphs:
 I emphasize again that the solution is the "X" coordinates of the intersection points.
The solution of inequality ![]() are those intervals where graph
are those intervals where graph ![]() is higher than graph
is higher than graph ![]() , and vice versa:
, and vice versa: ![]() is where graph
is where graph ![]() is lower than graph
is lower than graph ![]() .
.
Thus, the solution of inequality ![]() is the intervals
is the intervals ![]() - since the parabola is above the straight line. Conversely, the solution of inequality
- since the parabola is above the straight line. Conversely, the solution of inequality ![]() is intervals
is intervals ![]() , since the parabola is below the straight line. Similarly for non-strict inequalities.
, since the parabola is below the straight line. Similarly for non-strict inequalities.
By the way, is it clear to everyone how the general rules of ![]() are converted into partial rules for
are converted into partial rules for ![]() and
and ![]() ? Elementary. This is the case when
? Elementary. This is the case when ![]() , and this function defines the axis
, and this function defines the axis ![]() .
.
When is it convenient to use the graphical method?
First of all, in simple cases. For example, when solving the inequality ![]() it is easier to mentally represent the hyperbola than to use the method of intervals. Where is the hyperbola above the OX axis? On the interval
it is easier to mentally represent the hyperbola than to use the method of intervals. Where is the hyperbola above the OX axis? On the interval ![]() . The inequality
. The inequality ![]() corresponds to the left branch that lies below the axis, on the interval
corresponds to the left branch that lies below the axis, on the interval ![]() . This method is also good for a better understanding of mathematics.
. This method is also good for a better understanding of mathematics.
The graphical method will save you in extreme situations, for example when you have forgotten how to solve a quadratic equation, and there is no place to wait for help. Use the method described above - instead of the equation ![]() , consider
, consider ![]() with two simple graphs, which are very easy to construct.
with two simple graphs, which are very easy to construct.
Sometimes the graph is effective in equations with "heterogeneous" functions. For example, there are no standard analytical methods for solving the equation ![]() , but that's no problem. We imagine a graph of
, but that's no problem. We imagine a graph of ![]() and a graph of sine
and a graph of sine ![]() (about which later), after which it is immediately clear that the equation has a single root
(about which later), after which it is immediately clear that the equation has a single root ![]() .
.
By the way, in some problems you just need to determine the number of roots and / or their approximate location, and this question is often easily answered by the drawing!
Of course, the graphs must be simple - this is the most important condition for applying the graphical method. For it is not a good idea to build ![]() to solve
to solve ![]() :) Better the method of intervals.
:) Better the method of intervals.
2. If you find an error or inaccuracy, please describe it.
3. Positive feedback is welcome.