Function y=x2 and its graph
Earlier we studied other functions, such as the linear function; let us recall its standard form:
![]()
hence the obvious fundamental difference - in the linear function x is of the first power, and in the new function that we are about to study, x is of the second power.
Recall that the graph of a linear function is a straight line, and the graph of a function ![]() , as we will see, is a curve called a parabola.
, as we will see, is a curve called a parabola.
Let's start by finding out where the formula ![]() came from. The explanation is this: if we are given a square with side a, we can calculate its area this way:
came from. The explanation is this: if we are given a square with side a, we can calculate its area this way:
![]()
If we change the length of the side of the square, its area will also change.
Recall that variable x is an independent variable, or argument; in a physical interpretation, it could be, for example, time. Distance, on the other hand, is the dependent variable, it depends on time. The dependent variable or function is the variable y.
![]() – is the law of correspondence, according to which every value of x corresponds to a single value of y.
– is the law of correspondence, according to which every value of x corresponds to a single value of y.
Any law of correspondence must satisfy the requirement of uniqueness from argument to function. In physical interpretation, this looks quite clear on the example of the dependence of distance on time: at each moment of time we are at some particular distance from the starting point, and it is impossible at time t to be both 10 and 20 kilometers from the beginning of the path.
At the same time, each value of the function can be reached at several values of the argument.
Drawing the graph of the function y=x²
So, we need to plot the graph of the function ![]() and make a table to do this. Then use the graph to study the function and its properties. But even before drawing the graph, we can tell something about the properties of the function by the kind of function: obviously y cannot take negative values, because
and make a table to do this. Then use the graph to study the function and its properties. But even before drawing the graph, we can tell something about the properties of the function by the kind of function: obviously y cannot take negative values, because ![]()
So let's make a table:
|
x |
0 |
1 |
2 |
3 |
-1 |
-2 |
-3 |
|
y |
0 |
1 |
4 |
9 |
1 |
4 |
9 |
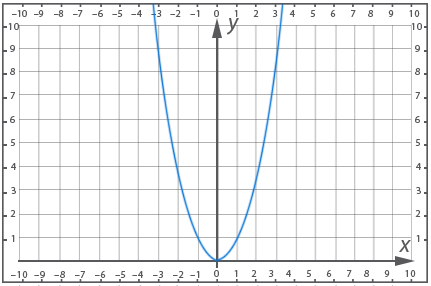
Fig. 1
Formulation of the properties of the function y=x²
It is not difficult to note the following properties of the graph:
- The y-axis is the symmetry axis of the graph;
- The vertex of the parabola is the point (0; 0);
- We see that the function takes only non-negative values;
- On the interval where ![]() the function decreases, and on the interval where
the function decreases, and on the interval where ![]() the function increases;
the function increases;
- The function gets the smallest value at the vertex, ![]() ;
;
- The greatest value of the function does not exist;
Solving typical problems
Example 1
Condition: Find the highest and lowest values of the function:
![]()
Solution:
Since x by convention varies on a particular interval, we can say about the function that it increases and varies on the interval [1; 9]. The function has a minimum value ![]() and a maximum value
and a maximum value ![]() on this interval
on this interval

Figure 2. Graph of the function y = x2, x ∈ [1; 3]
Example 2
Condition: Find the highest and lowest values of the function:
![]()
Solution:
x varies on interval ![]() , so y decreases on interval
, so y decreases on interval ![]() while
while ![]() and increases on interval
and increases on interval ![]() while
while ![]() .
.
So, the limits of variation of x ![]() , and the limits of variation of y
, and the limits of variation of y ![]() , and, therefore, on this interval there is both a minimum value of the function
, and, therefore, on this interval there is both a minimum value of the function ![]() and a maximum
and a maximum ![]()
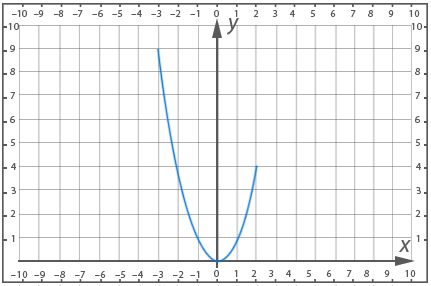
Figure 3. Graph of the function y = x2, x ∈ [-3; 2]
Summing up the lesson
Let us illustrate the fact that the same value of a function can be achieved for several values of the argument:
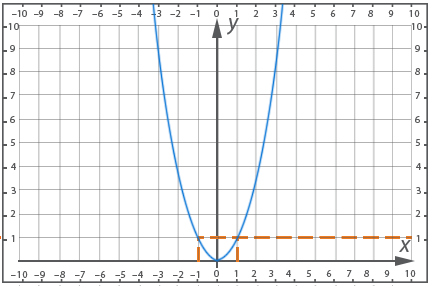
Figure 4.
In this figure we see that the value of the function equal to one is reached at two values of the argument:
![]()
Conclusion: In this lesson we got acquainted with the function ![]() , constructed its graph and formulated its properties. We also learned how to solve elementary typical problems, on the understanding of which more complex tasks will be based.
, constructed its graph and formulated its properties. We also learned how to solve elementary typical problems, on the understanding of which more complex tasks will be based.
2. If you find an error or inaccuracy, please describe it.
3. Positive feedback is welcome.