Today we are going to talk about statistics.
Statistics is a branch of mathematics that studies data collections, measurements, and analyze information presented in numerical form.
Thus, with the help of statistics, we can find out our state of affairs regarding finances. At the beginning of the month you can keep a diary of expenses and at the end of the month using statistics you can find out how much money you spend every day on average or how much you spend most often in this month.
On the basis of this information you can analyze and come up with certain conclusions: should you spend less money or not.
Sample. Volume. Spread.
What is a sample? In simple terms, it is the information we select for the study. For example, we might form the following sample - the amount of money spent on each of the six days. Let's draw a table in which we record the expenses for the six days
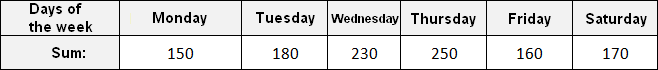
The sample consists of n elements. Any number can take the place of the variable n. We have six elements, so the variable n is 6
n = 6
The elements of the sample are denoted by variables with indexes ![]() The last
The last ![]() element is the sixth element of the sample, so instead of n there will be the number 6.
element is the sixth element of the sample, so instead of n there will be the number 6.
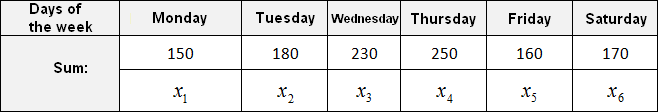
Denote the elements of our sample by the variables ![]()
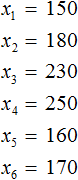
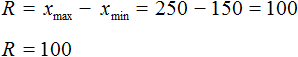
The spread is the difference between the largest and smallest element in the sample.
In our case, the largest element in the sample is element 250, and the smallest is element 150. The difference between them is 100

Arithmetic mean
The concept of average is often used in everyday life.
Examples:
- the average salary of the country's residents;
- students' grade point average;
- average speed of movement;
The arithmetic mean (or simply the mean or the average) is the result of dividing the sum of the sample elements by their number.
![]()
Let's go back to our example
Let's see how much we spent on average in each of the six days:
![]()
Average speed
When we studied motion tasks, we determined the speed of motion in the following way: we divided the distance traveled by the time. But then it was assumed that the body was moving at a constant speed, which did not change along the way.
In reality, this happens quite rarely or not at all. The body tends to move at different speeds. It can slow down or drive faster during its trip.
When we drive a car or bicycle, our speed often changes. When there are obstacles ahead of us, we have to slow down. When the road is clear, we speed up. During our acceleration, our speed changes several times.
It's the average speed. To determine it, add the speeds that were in each hour/minute/second and divide the result by the travel time.
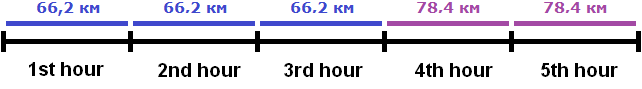
Task 1. A car drove for the first 3 hours at a speed of 66.2 km/h, and for the next 2 hours at a speed of 78.4 km/h. What is this car average speed?
Add the speeds the car had in each hour and divide by the driving time (5h)
![]()
So the car drove at an average speed of 71.08 km/h.
You can use another way to determine the average speed - first find the distances traveled at the same speed, then add up these distances and divide the result by the time. You can see in the picture that the car's speed did not change for the first three hours. Then we can find the distance traveled in three hours:
66.2 × 3 = 198.6 km.
Similarly, we can find the distance traveled at a speed of 78.4 km/h. The problem states that the car traveled at this speed for two hours:
78.4 × 2 = 156.8 km.
Add these distances and divide the result by 5
![]()
Task 2. A cyclist rode 12.6 km in the first hour, and in the next 2 hours he rode at a speed of 13.5 km/h. Find the average speed of the cyclist.
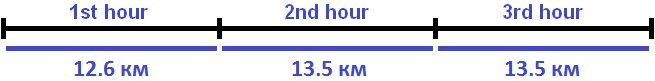
The cyclist's speed in the first hour was 12.6 km/h. In the second and third hours he rode at a speed of 13.5. Find the average speed of the cyclist:
![]()
Mode and median
A mode is the element that occurs more often in the sample than the others (most frequent number).
Consider the following sample: six athletes, and the time, in seconds, in which they run 100 meters

Element 14 is the most frequent in the sample, so we will call element 14 a mode.
Let's consider another sample. The same athletes, as well as the smartphones they own
The element iphone is found in the sample more often than others, so the element iphone is mode.
Of course the elements of the sample this time are expressed not by numbers, but by other objects (smartphones), but for the general idea of mode this example is quite acceptable.
Consider the following sample: seven athletes and their height in centimeters:
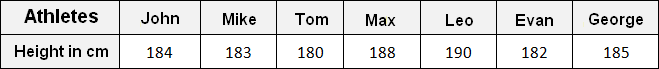
Arrange the data in the table so that the height of the athletes goes in ascending order. In other words, let's line up the athletes by height:
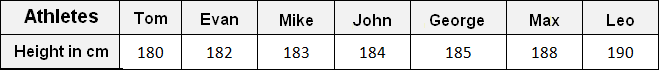
Let's write out the height of the athletes separately:
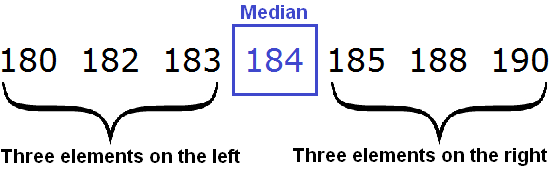
180, 182, 183, 184, 185, 188, 190
There are 7 elements in the resulting sample. In the middle of this sample is item 184. To the left and right of it are three elements each. An element such as 184 is called the median of the ordered sample.
The middle number that is found by ordering all data points and picking out the one in the middle.
Note that this definition is true if the number of elements in the ordered sample is odd.
In the above example, the number of elements in the ordered sample was odd. This allowed us to quickly specify the median
But there may be cases where the number of elements in the sample is even.
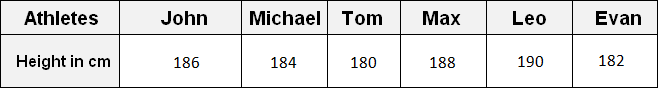
For example, consider a sample in which there are not seven athletes, but six:
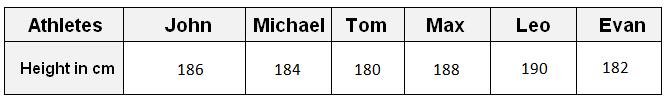
Let's line up these six athletes by height:
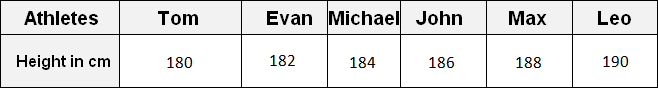
Let's write out the height of the athletes separately:
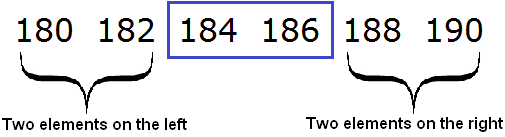
180, 182, 184, 186, 188, 190
In this sample, you cannot specify an element that would be in the middle. If you specify element 184 as the median, then to the left of this element there will be two elements and to the right there will be three elements. If you specify element 186 as the median, then there are three elements to the left of that element and two elements to the right.
In these cases, to determine the sample median, you must take the two elements in the middle of the sample and find their arithmetic mean. The result will be the median.
Let's return to our athletes. In the ordered sample of 180, 182, 184, 186, 188, 190, the elements 184 and 186 are in the middle
Find the arithmetic mean of elements 184 and 186
![]()
The element 185 is the median of the sample, even though this element is not a member of the original and ordered sample. An athlete who is 185 is not among the other athletes. The height of 185 cm is used here for statistics so that we can say that the median height of the athletes is 185 cm.
Therefore, a more accurate definition of the median depends on the number of elements in the sample.
If the number of elements in an ordered sample is odd, then the median of the sample is the element that is in the middle.
If the number of elements in an ordered sample is even, then the median of the sample is the arithmetic mean of the two numbers that are in the middle of the sample.
The median and the arithmetic mean are essentially "close relatives" because both are used to determine the mean. For example, for the previous ordered sample of 180, 182, 184, 186, 188, 190, we determined the median to be 185. The same result can be obtained by determining the arithmetic mean of the elements 180, 182, 184, 186, 188, 190
![]()
But the median in some cases reflects a more realistic situation. For example, consider the following example:
The number of points available for each athlete was calculated. The result is the following sample:
0, 1, 1, 1, 2, 1, 2, 3, 5, 4, 5, 0, 1, 6, 1
Let's determine the arithmetic mean for this sample - we get a value of 2.2
![]()
We can tell from this value that the athletes have an average of 2.2 points
Now let's determine the median for the same sample. Arrange the elements of the sample and indicate the element in the middle:
0, 0, 1, 1, 1, 1, 1, 1, 2, 2, 3, 4, 5, 5, 6
In this example, the median is a better representation of the real situation, since half of the athletes have less than one point.
Frequency
Frequency is a number that shows how many times an item occurs in the sample.
Suppose there is a pull-up competition at school. There are 36 students in the competition. Let's make a table in which we will record the number of pull-ups, as well as the number of participants who did that many pull-ups.
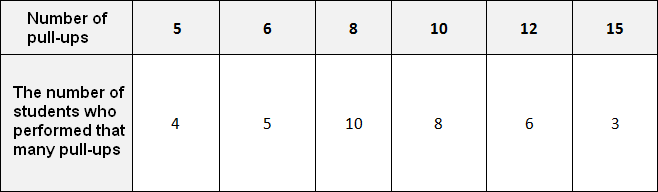
The table shows how many people did 5, 10, or 15 pull-ups. For example, four people did 5 pull-ups, eight people did 10 pull-ups, and three people did 15 pull-ups.
The number of people repeating the same number of pull-ups in this case is the frequency. So let's rename the second row of the table "frequency":
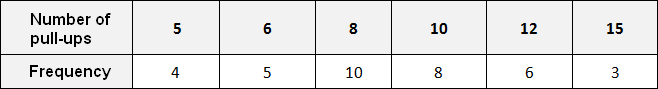
Such tables are called frequency tables.
Frequency has the following property:
the sum of frequencies equals the total number of data in the sample.
This means that the sum of frequencies is equal to the total number of students participating in the competition, that is, thirty-six. Let us check whether this is true. Let us add up the frequencies given in the table:
4 + 5 + 10 + 8 + 6 + 3 = 36
Relative frequency
Relative frequency is basically the same frequency that was discussed earlier, but expressed as a percentage.
Relative frequency - is how often something happens divided by all outcomes
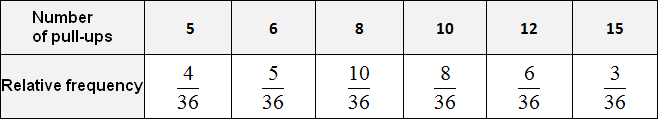
Relative frequency is equal to the ratio of frequency to the total number of elements in the sample.
Let's return to our table:
Five pull-ups were performed by four people out of 36. Six pull-ups were done by 5 people out of 36. Eight pull-ups were done by 10 people out of 36, and so on. Let's fill in the table with these ratios:
Perform division in these fractions:
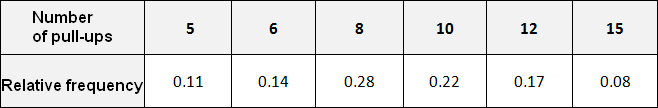
Let's express these frequencies as a percentage. To do this, multiply them by 100. It is convenient to multiply by 100 by moving the point two digits to the right:
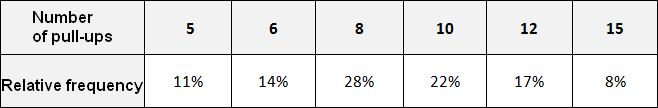
Now we can say that five pull-ups were performed by 11% of the participants, six pull-ups were performed by 14% of the participants, eight pull-ups were performed by 28% of the participants, and so on.
2. If you find an error or inaccuracy, please describe it.
3. Positive feedback is welcome.